
May 26, 2020
Written by: Carolyn Keating
At first glance, a mouse brain doesn’t seem all that remarkable. About the size of a peanut, its smooth surface sort of looks like one too. But even though it all looks the same, brain regions just a few millimeters apart can be responsible for very different processes. So how’s a scientist supposed to figure out what area they’re looking at? Enter brain atlases. Just like geographical maps, researchers use maps of the brain to determine the locations of different subregions. These reference atlases are vital for planning experiments and interpreting or visualizing collected data, as well as standardizing anatomy across different labs.
Reference atlases need to do two things. They need to show a picture of what the brain looks like, and they need to label the different structures. These structures are typically identified by staining the tissue with compounds that label different components of the brain, such as cell bodies or the myelin that wraps around long projections. Usually, these stains are applied to a single brain that has been cut up in regular intervals, with the end result being a series of 2D images labeled with the different structures.
As new techniques of examining the brain are created, atlases can be improved. For instance, maps of gene expression, connectivity patterns, and functional properties have revealed differences between brain areas1–3. However, no one atlas has combined all of these techniques in order to more accurately identify regions in the entire brain of mammals like mice. What’s more, because the brain is a three-dimensional object, sometimes applying a 2D map to a 3D space results in some complications.
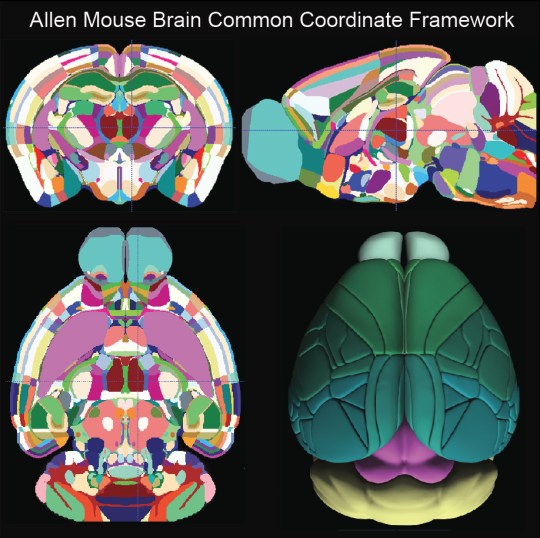
To solve these problems, scientists at the Allen Brain Institute created the third version of the Allen Mouse Brain Common Coordinate Framework (CCF)4. Using a type of microscopy called serial two-photon tomography, they scanned the brains of an unprecedented 1,675 mice to create an average template brain. The template brain is divided into units of space, called voxels, of 10 µm, which is small enough to capture individual neurons! The final template had around 506 million voxels, each assigned to one of 43 cortical areas, 329 deeper structures, 8 fiber tracts, and 8 ventricular spaces (Figure 1).
Identifying the various regions took several steps. First the scientists reviewed previously published atlases and literature for a given structure, analyzed features of the average template (such as varying light and dark areas in unstained tissue that signal specific structures), and incorporated data from other types of maps. These other maps included data from mice genetically engineered to label certain types of cells, data showing axonal projections, data showing the location of cells expressing different genes, and typical tissue stains described earlier. Then neuroanatomists overlaid all this data on the average template brain and reconstructed the structures directly in three dimensions. The cortex required a few extra steps. Since the surface of the brain is curved, the scientists developed a system using “streamlines” to find the shortest path to the surface of the brain in order to accurately map the cortex (multicolored lines in video below).
The end result is a new atlas with the highest spatial resolution of any 3D reference brain, even 1000 times higher than the previous version of the CCF. Its 658 labeled structures are far more than any MRI-based atlases, though fewer than conventional 2D atlases, due in part to the time- and labor-intensive work of manually identifying so many structures in three dimensions. The atlas presently does not detail how the template brain matches up to landmarks on the skull, which researchers use during surgeries to target specific brain regions. Nevertheless, the atlas is openly available for any researcher to access for free. Users can even view the atlas in a 2D version side-by-side with the reference data (such as the gene expression maps or tissue stains) used to identify the structures.
The atlas has been available since late 2017, and already been used by several groups of scientists. For instance, one group measuring neural activity across the entire brain used the atlas to map which regions were active in different behaviors5. Another group used it to map active neurons across the brain during a visual decision-making task6. As more scientists employ this resource in their own studies, we will learn more about precisely how the brain works.
References
- Ng, L. et al. An anatomic gene expression atlas of the adult mouse brain. Nat. Neurosci. 12, 356–362 (2009).
- Oh, S. W. et al. A mesoscale connectome of the mouse brain. Nature 508, 207–214 (2014).
- Harris, J. A. et al. Anatomical characterization of Cre driver mice for neural circuit mapping and manipulation. Front. Neural Circuits 8, 76 (2014).
- Wang, Q., Ding, S. L., Li, Y., … & Ng, L. The Allen Mouse Brain Common Coordinate Framework: A 3D Reference Atlas. Cell in press, 936-953.e20 (2020).
- Musall, S., Kaufman, M. T., Juavinett, A. L., Gluf, S. & Churchland, A. K. Single-trial neural dynamics are dominated by richly varied movements. Nat. Neurosci. 22, 1677–1686 (2019).
- Steinmetz, N. A., Zatka-Haas, P., Carandini, M. & Harris, K. D. Distributed coding of choice, action and engagement across the mouse brain. Nature 576, 266–273 (2019).
Images
Cover Image of the Allen Mouse Brain Common Coordinate Framework (version 3 (2017)) from the Allen Institute © 2004 Allen Institute for Brain Science. Allen Mouse Brain Atlas. Available from: http://atlas.brain-map.org/.
Figure 1 from the Allen Institute. Press release: “A new high-resolution, 3D map of the whole mouse brain” May 7, 2020. https://alleninstitute.org/what-we-do/brain-science/news-press/articles/new-high-resolution-3d-map-whole-mouse-brain
Figure 2: Video from the Allen Institute. https://www.youtube.com/watch?v=4DXgMXcwDNA

Leave a comment